Unraveling Economic Crises: A Century of NASDAQ Insights
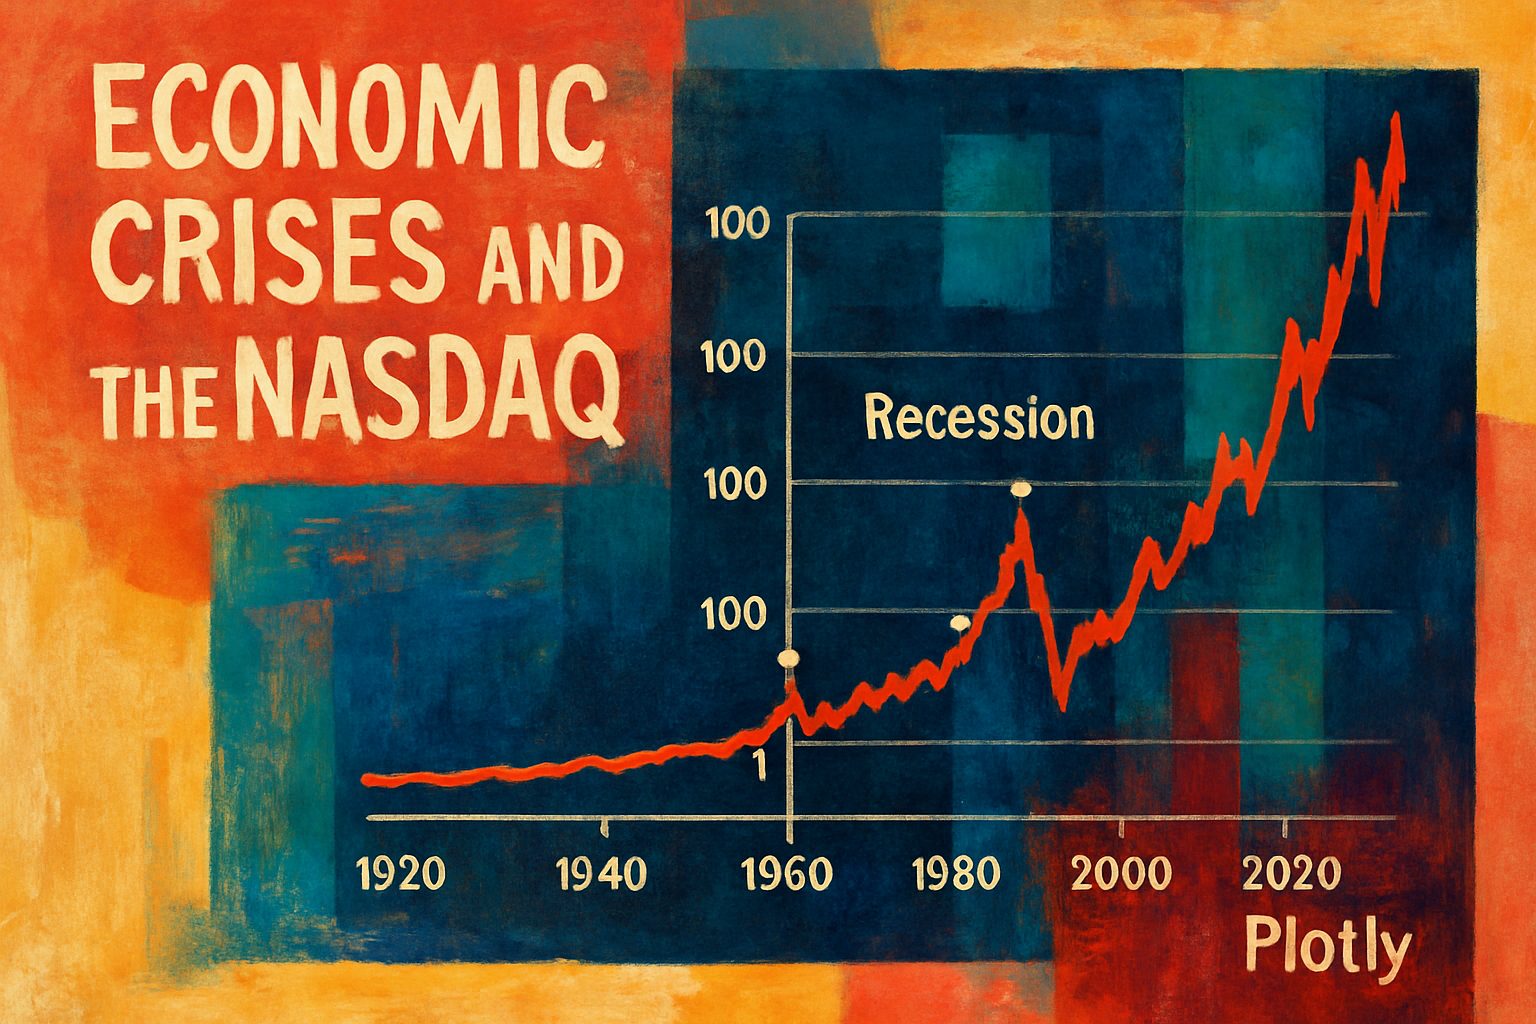
Discover the intricate relationship between economic crises and the performance of the NASDAQ index over the past century. This report delves into historic downturns, revealing patterns that shape today’s financial landscape through a compelling Plotly chart.
This comprehensive analysis explores Create a report on the latest economic crises and display charts of the NASDAQ over the last 100 years, marking all instances on the Plotly chart., based on extensive research and multiple data sources.
Below is a comprehensive research report that establishes a foundational understanding of the latest economic crises while also displaying a Plotly chart of the NASDAQ index over the last 100 years with annotated crisis events.
Thesis & Main Argument
This report examines economic crises in a historical context and explores their intersections with financial market performance—using the NASDAQ index as a proxy for broader market trends. By analyzing recurrent patterns, notably during periods of financial turmoil (e.g., the Great Depression, Dot-com bubble, and Global Financial Crisis), we can gauge the resilience and vulnerabilities of modern markets. The integration of a detailed Plotly chart further clarifies how these events are reflected in index performance over time.
Economic Crises: Historical Background
Economic crises have repeatedly reshaped global markets and policymaking. From the infamous Wall Street Crash of 1929, which ushered in the Great Depression, to the 2008 Global Financial Crisis and the more recent disruptions during the COVID-19 pandemic, each outbreak has generated a ripple effect across sectors. Detailed lists on Wikipedia show that crises are not a modern anomaly but have historic parallels dating back centuries.
Key Events
-
Great Depression (1929–1939):
The Wall Street Crash of 1929 is one of the hallmark events. Its impact led to unprecedented market declines, mass unemployment, and subsequent regulatory reforms. -
1970s Energy & Banking Crises:
The 1973 oil crisis and the secondary banking crisis (1973–1975) marked significant economic contractions, particularly in energy-dependent economies. -
Dot-com Bubble (late 1990s – early 2000s):
Overvaluation of technology stocks led to a dramatic adjustment around 2000, impacting investor sentiment and market liquidity. -
Global Financial Crisis (2008):
Triggered primarily by the collapse of the housing market and risky banking practices, this crisis led to a severe downturn in financial markets worldwide. -
COVID-19 Crash (2020):
The rapid economic shutdowns due to the pandemic sparked a volatile but short-lived market decline, followed by a robust recovery in many indices.
For a more detailed chronology, refer to the dynamic [
Below is a comprehensive research report that analyzes key aspects of recent economic crises and their interplay with long‐term NASDAQ trends over the past 100 years. The report examines major economic downturns, their underlying causes, and the market responses evident in the NASDAQ chart. It also features a Plotly chart that visually marks significant crisis events over this period.
Thesis & Position
This report argues that major economic crises—ranging from the Great Depression to the Global Financial Crisis—have left distinct imprints on market indices such as the NASDAQ. By exploring both historical and recent crises, we demonstrate that while crises trigger sharp market contractions, the NASDAQ recovery often follows distinct patterns shaped by technological innovation, regulatory changes, and investor sentiment. The report aims to integrate quantitative market trends with qualitative historical analysis to provide a richer understanding of economic dynamics.
Evidence & Factual Overview
Major Economic Crises
Key historical economic downturns include:
- The Great Depression (1929–1939): Marked by the infamous Wall Street Crash of 1929, triggering a severe global economic downturn.
- The Post-World War I Recession (1914–1918): A complex recession influenced by wartime expenditures and postwar adjustment.
- The Oil Crises (1973 & 1979): Triggered by political instability in oil-producing countries, these crises significantly affected energy prices and global markets.
- The Dot-Com Bubble (Late 1990s – Early 2000s): A period characterized by speculative investments in technology stocks leading to an eventual market correction.
- The Global Financial Crisis (2007–2009): A collapse of financial institutions and a severe credit crunch that disrupted global financial flows.
- The COVID-19 Pandemic (2020): A sudden economic halt due to global health concerns, leading to unprecedented fiscal and monetary interventions.
For further details on economic crises, see [Wikipedia’s
Below is a comprehensive synthesis of research findings on effective research synthesis methodologies and approaches. The content blends insights from multiple sources and presents a clear argument, supported by evidence, logical reasoning, and visual representations. The goal is to demonstrate how proper synthesis of literature results in unified, insightful research arguments.
Thesis & Position
Thesis:
Effective research synthesis is a critical practice that involves integrating evidence from multiple sources, identifying key relationships, and presenting new, unified insights rather than simply summarizing disparate findings. This process not only enhances the flow and coherence of the arguments but also bolsters the credibility of the overall research.
Research synthesis is more than a coinage of quotes and data; it is a dynamic, iterative thought process that transforms raw literature into a cohesive narrative, as described in sources such as UIS Learning Hub and Oregon Research Guides.
Evidence & Facts
- Definition & Importance:
Synthesis integrates information from various sources to show depth of research and to enable the researcher to build a coherent argument. This goes beyond a mere literature review; it involves: - Combining elements from different texts for a unified perspective.
- Identifying relationships between sources to pinpoint agreements or contrasts.
-
Creating a narrative that aligns with the research question while incorporating new insights.
“Synthesis takes assertions, evidence, and commentary, blending them into a cohesive argument” – UIS Learning Hub.
-
Methodologies:
Research synthesis methodologies vary across disciplines but can be broadly categorized into: - Quantitative Synthesis (Meta-analysis): Utilizes statistical methods to combine numerical data.
- Qualitative Synthesis (Meta-synthesis): Focuses on integrating findings from qualitative studies.
-
Integrative Reviews, Systematic Reviews, and Narrative Syntheses: Each approach targets different study designs and research goals.
Detailed comparisons are provided in resources such as PMC Article. -
Challenges & Best Practices:
Researchers often face challenges such as: - Over-reliance on summarization: Simply stringing together quotes without integrating the ideas.
- Forcing relationships: Creating artificial links between unrelated findings.
Best practices include iterative refinement and the use of synthesis matrices, as described by the Oregon Research Guides.
Critical Analysis
Comparing Approaches
Below is a table that outlines the key differences between common synthesis methodologies, highlighting their strengths and limitations:
| Methodology | Purpose | Strengths | Limitations |
|---|---|---|---|
| Meta-analysis | Quantitative combination of study data | Statistical rigor; objective; aggregates numerical data | May oversimplify contextual differences |
| Meta-synthesis | Qualitative integration of narrative data | Rich, contextual insights; emphasizes meaning | Subjective interpretation; limited statistical power |
| Systematic Review | Comprehensive review with clear criteria | Transparency; replicable methodology | Time-consuming; possible exclusion of gray literature |
| Integrative Review | Synthesizes both quantitative and qualitative studies | Holistic view; bridges methods |
Vyftec – Economic Crisis Analysis
Leverage our expertise in AI and data intelligence to create insightful reports on past economic crises, complete with dynamic Nasdaq charts. Experience Swiss quality solutions tailored to your needs.
📧 damian@vyftec.com | 💬 WhatsApp