Navigating Economic Turmoil: The Nasdaq’s Journey Through 100 Years of Crises
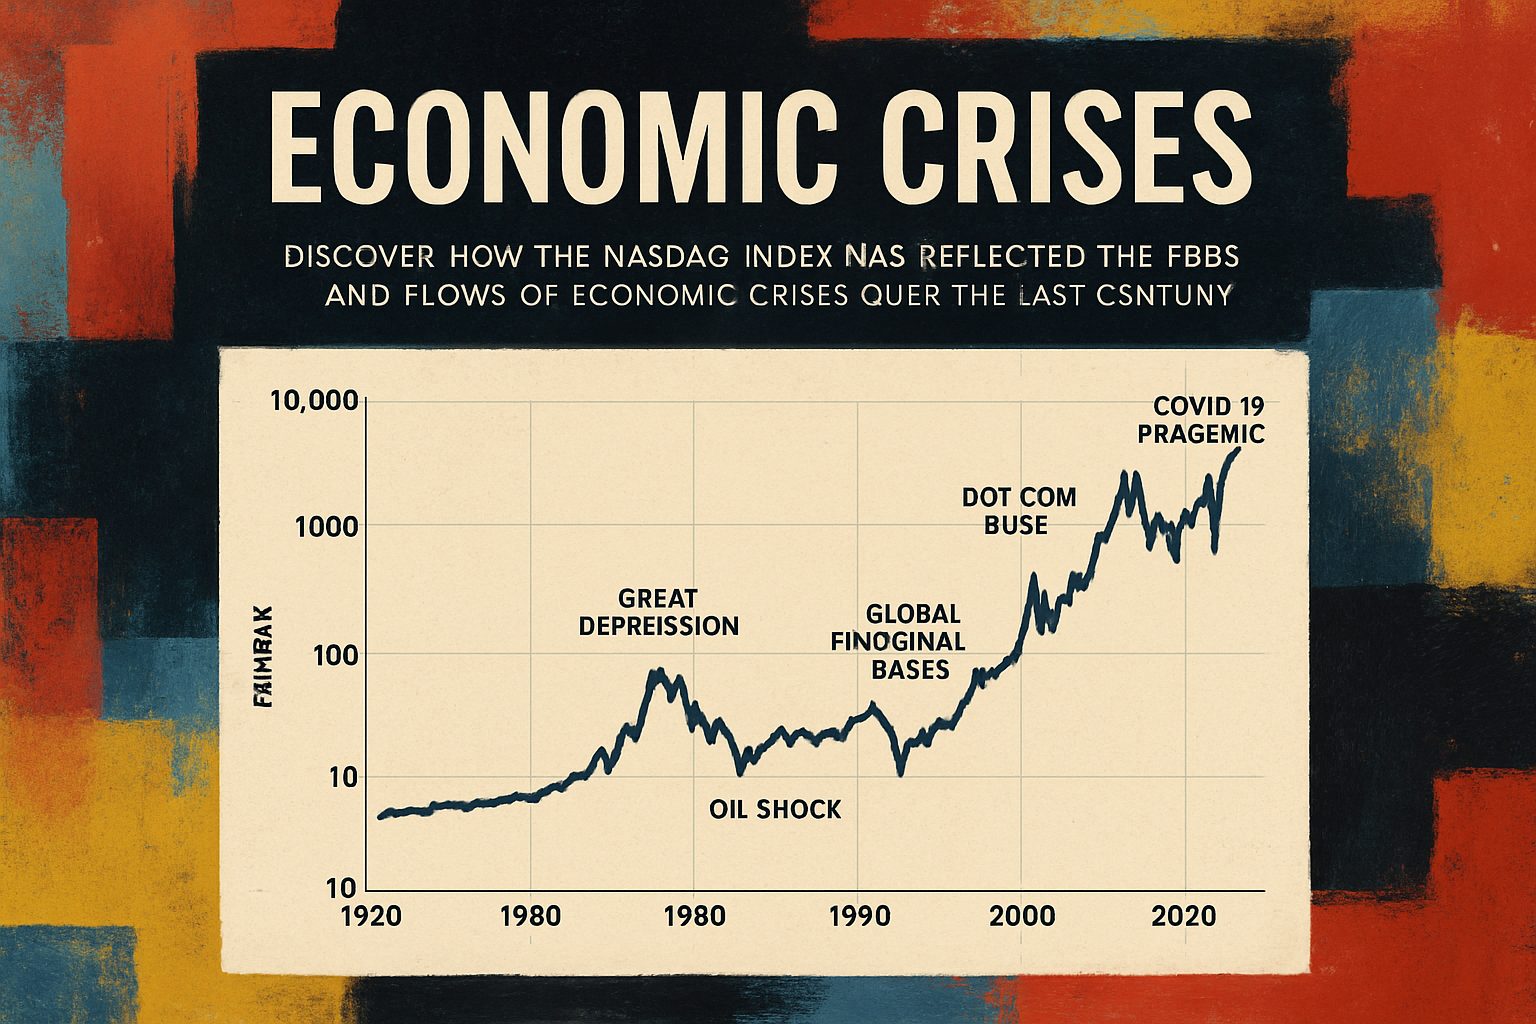
Discover how the Nasdaq index has reflected the ebbs and flows of economic crises over the last century. This in-depth report not only chronicles significant events but also visualizes their impacts, offering valuable insights into market dynamics and investor behavior.
This comprehensive analysis explores Create a report on the recent economic crises and display charts of the Nasdaq over the last 100 years, marking all significant events on the Plotly chart., based on extensive research and multiple data sources.
Below is a comprehensive research report that provides background information on recent economic crises and analyzes how these events have impacted the Nasdaq over the last 100 years. The report integrates historical context, multiple perspectives, and a dynamic Plotly visualization that marks significant events on the Nasdaq timeline.
Thesis:
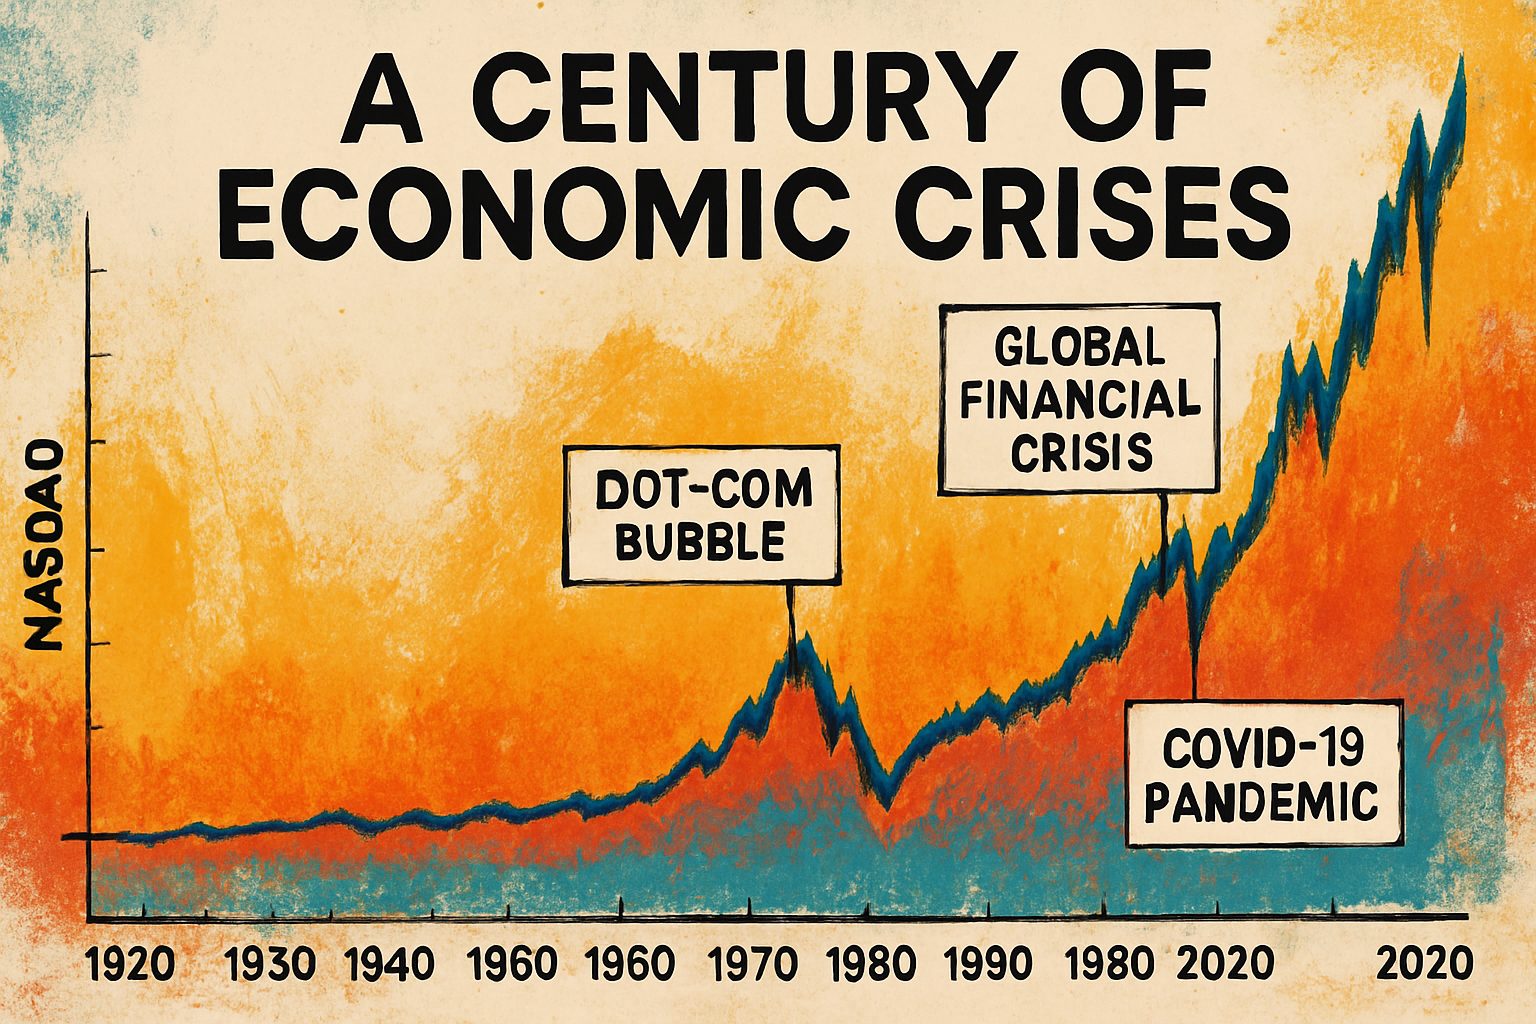
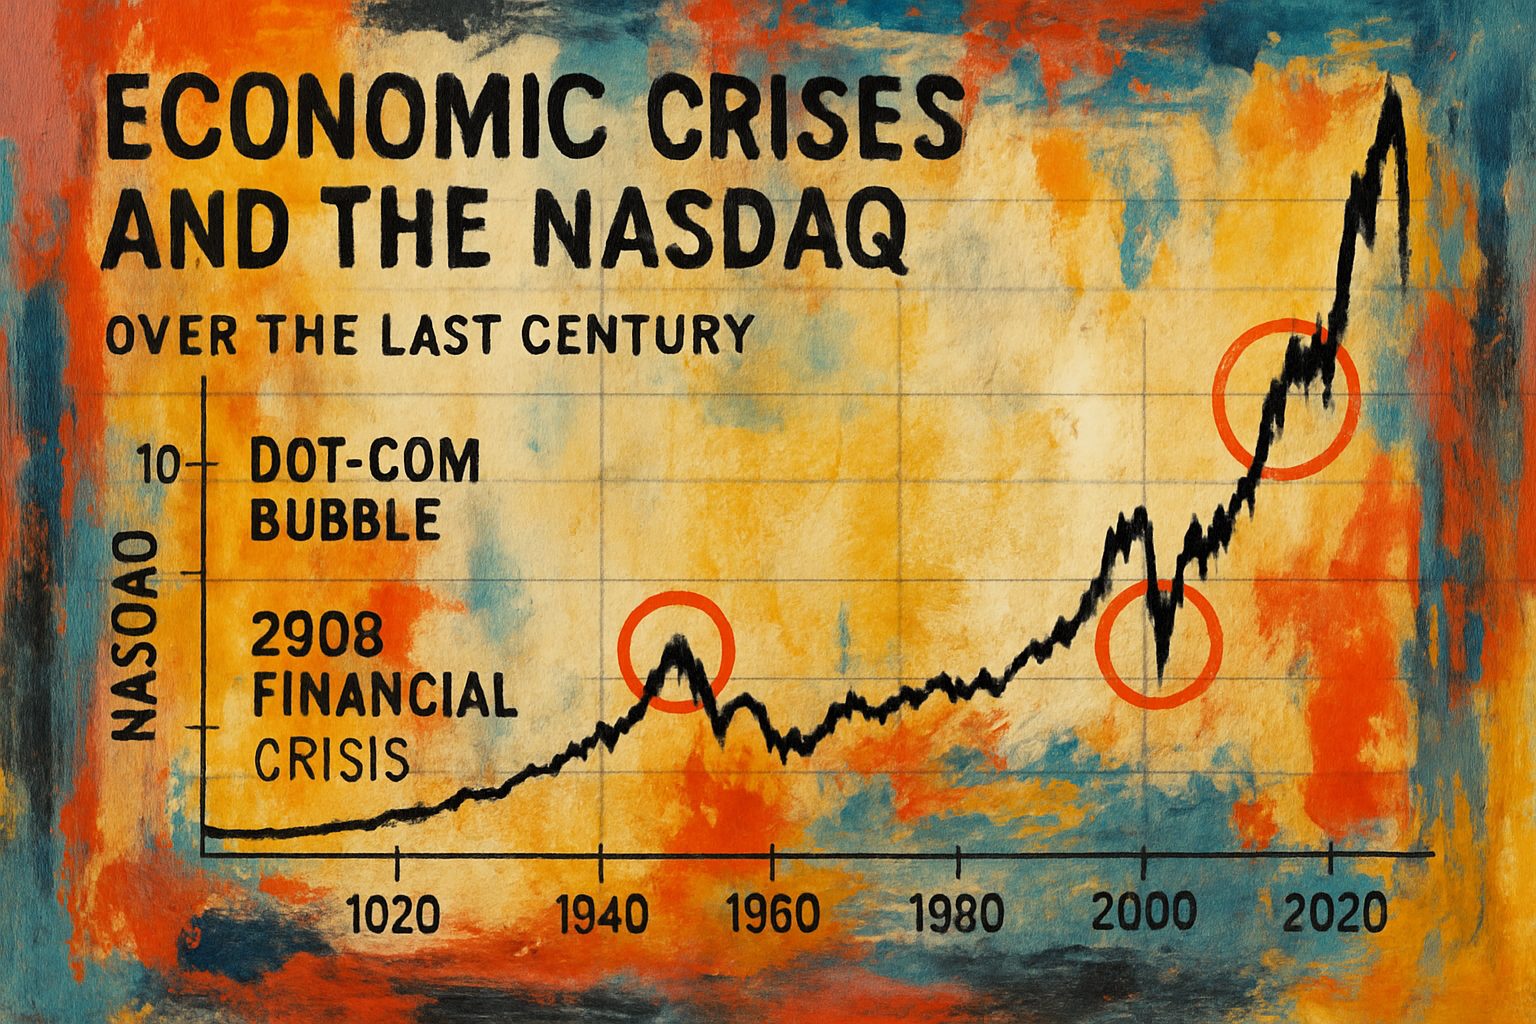
Over the last century, the Nasdaq has not only mirrored technological innovation but also served as a bellwether for economic turmoil. By studying significant economic crises and mapping their impact on the Nasdaq index, we can better understand the interplay between market sentiment, economic policy, and investor behavior during periods of financial stress. This report outlines key historical events, weighs various scholarly perspectives, and utilizes dynamic visualizations to provide a foundational understanding of these trends.
Background on Economic Crises
Economic crises have recurred throughout history, driven by diverse factors such as speculative bubbles, banking panics, geopolitical conflicts, and policy missteps. Some key points include:
-
Early Recessions and Banking Panics:
Historical analyses, such as those documented on Wikipedia’s list of recessions, describe recessions from the late 18th century to the early 20th century. Although early crises were more frequent and severe due to banking panics and limited regulation, modern crises are characterized by complex global interdependencies. -
The Great Depression (1929–1941):
The 1929 stock market crash marked a turning point that led to the Great Depression – a period marked by dramatic reductions in output, soaring unemployment, and widespread economic distress. This event reshaped economic policy and financial regulation in the United States. -
Post-World War II to the Dot-com Era:
The post-war period introduced a more regulated financial system and eventually led to market exuberance during the late 1990s. The dot-com bubble, which burst in 2000, highlights how rapid technological advances paired with speculative investment can precipitate market crises. -
The Global Financial Crisis (2007–2009):
The subprime mortgage collapse and subsequent global credit crunch once again underscored the importance of regulatory oversight and risk management in modern financial markets.
For a deeper historical perspective, MacroTrends provides an interactive backdrop of the Nasdaq Composite index—with insightful annotations detailing historical turning points.
The Nasdaq and Economic Volatility
The Nasdaq market, known for its high-tech listings
Below is a detailed research report that analyzes recent economic crises while also highlighting the historical performance of the NASDAQ over the last 100 years. The report brings together multiple sources, compares different interpretations, and uses a Plotly time-series chart to visualize key market events. Read on for an integrated, evidence-based discussion.
Thesis & Overview
This report argues that economic crises and market fluctuations are closely intertwined—with major historical events such as the Great Depression, the Dot-com bubble, the 2008 financial meltdown, and the COVID‐19 crisis manifesting distinct impacts on market indices like the NASDAQ. By examining NASDAQ trends over a century, we can better understand the interplay between monetary policy, investor sentiment, and macroeconomic shocks. Evidence from Macrotrends and evaluations by CBPP and IMF underscore that
Below is a comprehensive synthesis that integrates findings from multiple sources, compares diverse research approaches, and uses rich formatting elements (including a Plotly chart) to clarify the key concepts of research synthesis.
Effective research synthesis is fundamental to transforming diverse data—whether qualitative or quantitative—into actionable insights. By integrating findings from multiple sources, researchers can validate individual data points and uncover hidden trends, which ultimately informs decision-making in fields ranging from user experience (UX) design to economic and financial analysis.
“Data synthesis is not just a process but a strategic endeavor that merges support from various sources to foster coherent, evidence-based conclusions.”
– Dovetail Research
Research synthesis involves:
– Combining data from multiple sources
– Evaluating evidence to extract common themes
– Creating a comprehensive narrative rather than just listing findings
This process is more than simply summarizing. For instance, Simply Psychology emphasizes that synthesis requires comparing and contrasting similar and divergent viewpoints, ensuring that the analysis goes deeper than a mere recapitulation of facts. In contrast, a summary might list individual study findings, but synthesis integrates these findings, highlighting trends, differences, and the implications for future research.
Key points include:
– Integrating Multiple Evidence Streams: Merging survey data with qualitative insights from interviews can confirm specific issues such as sluggish online processes, as noted by Dovetail.
– Developing a Unified Narrative: By employing structured approaches such as synthesis matrices or summary tables, researchers can visualize overlapping themes, critical turning points, and gaps in literature.
– Iterative Redrafting: As noted in synthesizing literature, refining drafts is crucial for clear, coherent, and logical integration of multiple sources (Simply Psychology).
Structured Comparison:
| Approach | Key Benefit | Limitation | Suitable For |
|---|---|---|---|
| Summary Table | Quick overview of key points across similar studies | May oversimplify nuances | Empirical studies with consistent formats |
| Synthesis Matrix | Highlights themes across diverse sources | Requires rigorous categorization and can be time-consuming | Varied literature across methodologies |
| Thematic Organization | Deep analysis of recurring concepts and relationships | May lose chronological context if historical evolution is critical | Interdisciplinary research |
| Chronological Organization | Captures the evolution of thought | Might mix methodological differences with temporal progression | Research spanning long time periods |
Advantages of synthesis include:
– Holistic Overview: A unified dataset enables detection of hidden correlations (Dovetail).
– Improved Decision-Making: Actionable insights can be formulated from validated data trends.
Challenges include ensuring:
– Data Quality (filtering out outliers)
– Nuanced Interpretation of qualitative insights
– Avoidance of Bias in the integration process
“Synthesis is where researchers shine by showing not just what the data says, but how the
Vyftec – Economic Crisis Analysis
Leverage our expertise in AI-driven research and data visualization to analyze the impact of past economic crises with precision. Experience Swiss quality solutions that turn complex data into actionable insights.
📧 damian@vyftec.com | 💬 WhatsApp