


Navigating Economic Turbulence: A 100-Year Journey of the NASDAQ Through Crises
Explore the intricate relationship between major economic crises and the NASDAQ index over the last century. This report provides compelling visualizations and insights into how pi
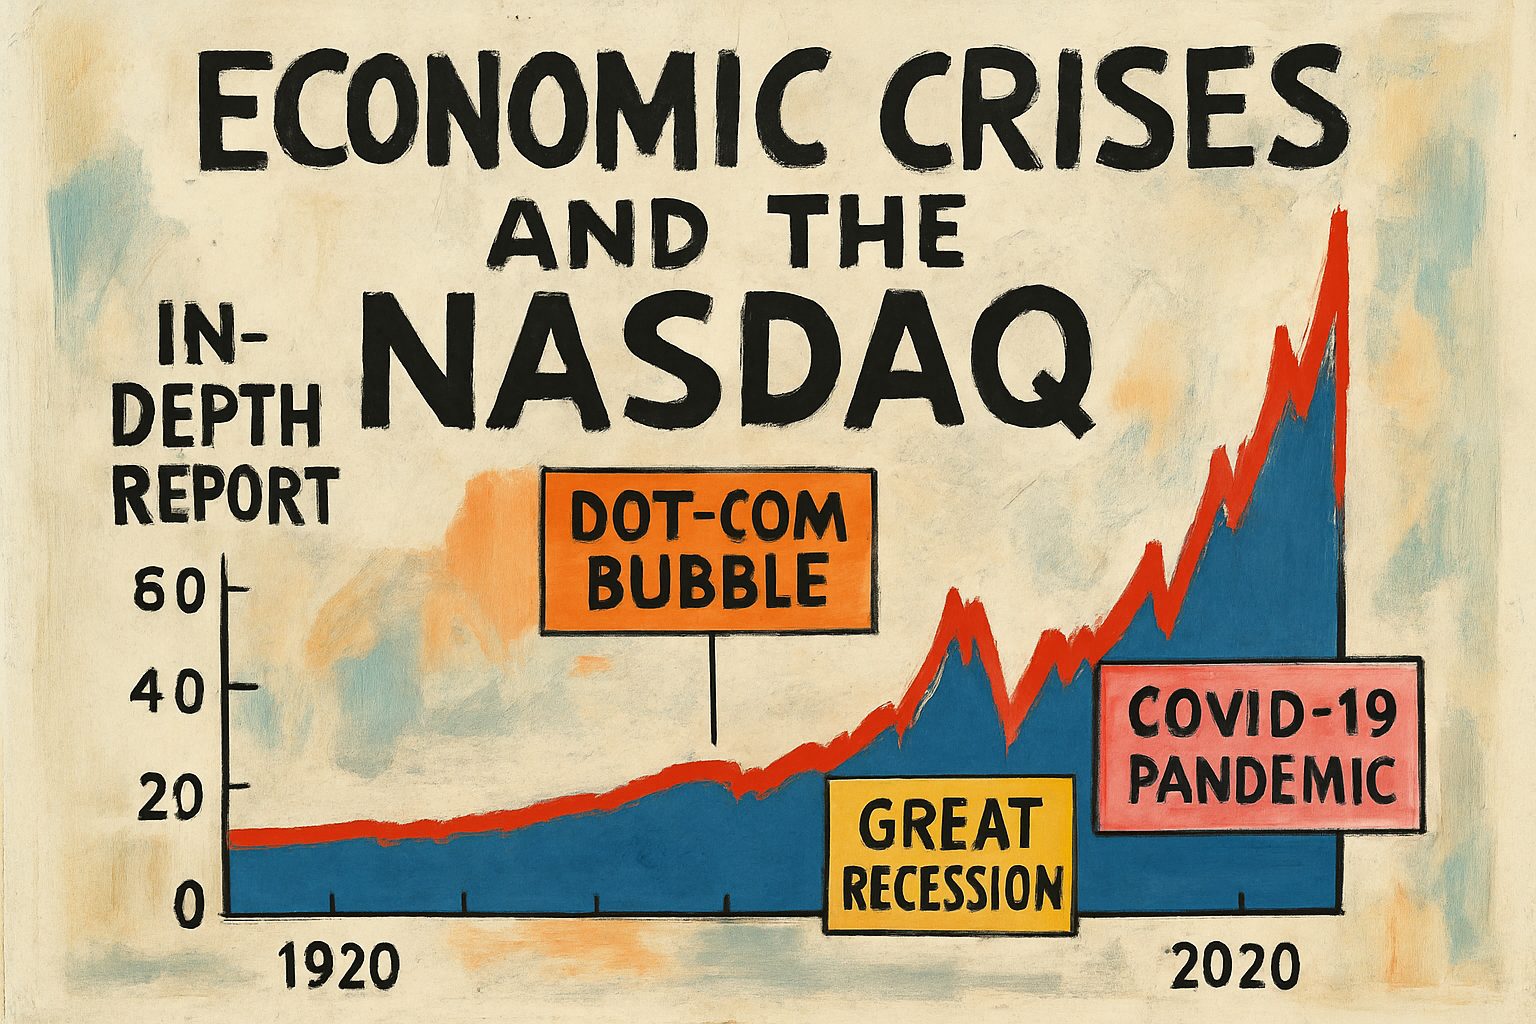
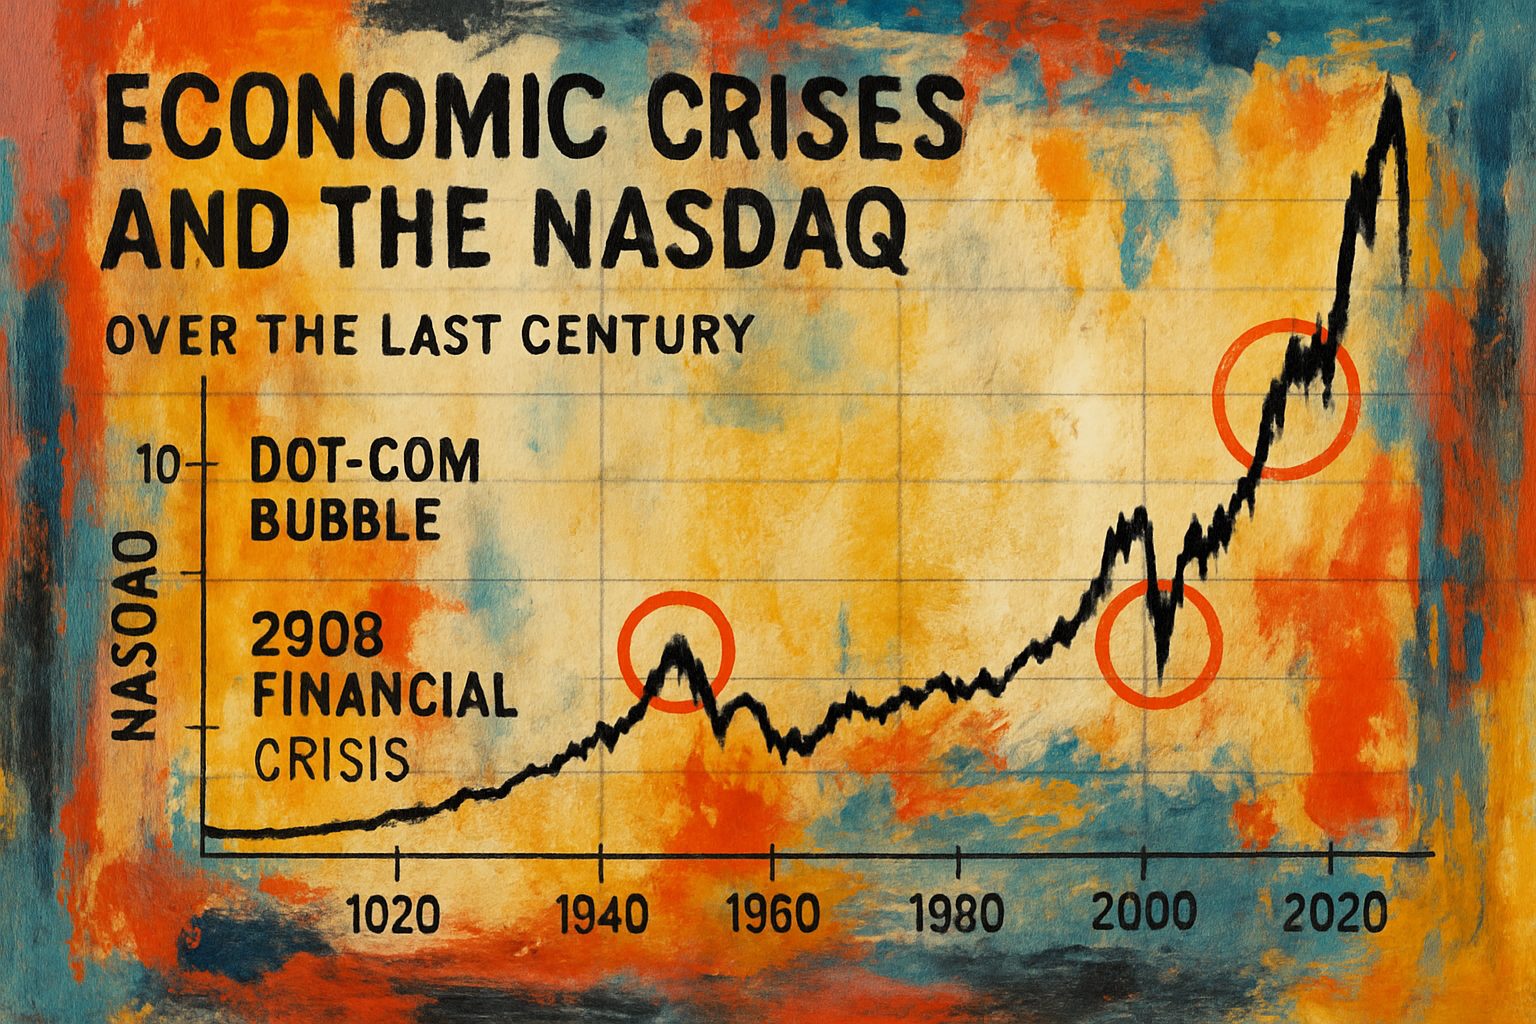
Unraveling Economic Crises: A 100-Year Analysis of the NASDAQ’s Resilience
Dive into our in-depth report that unveils the impact of major economic crises on the NASDAQ Composite Index over the past century. Explore how pivotal events like the Dotcom Bubbl
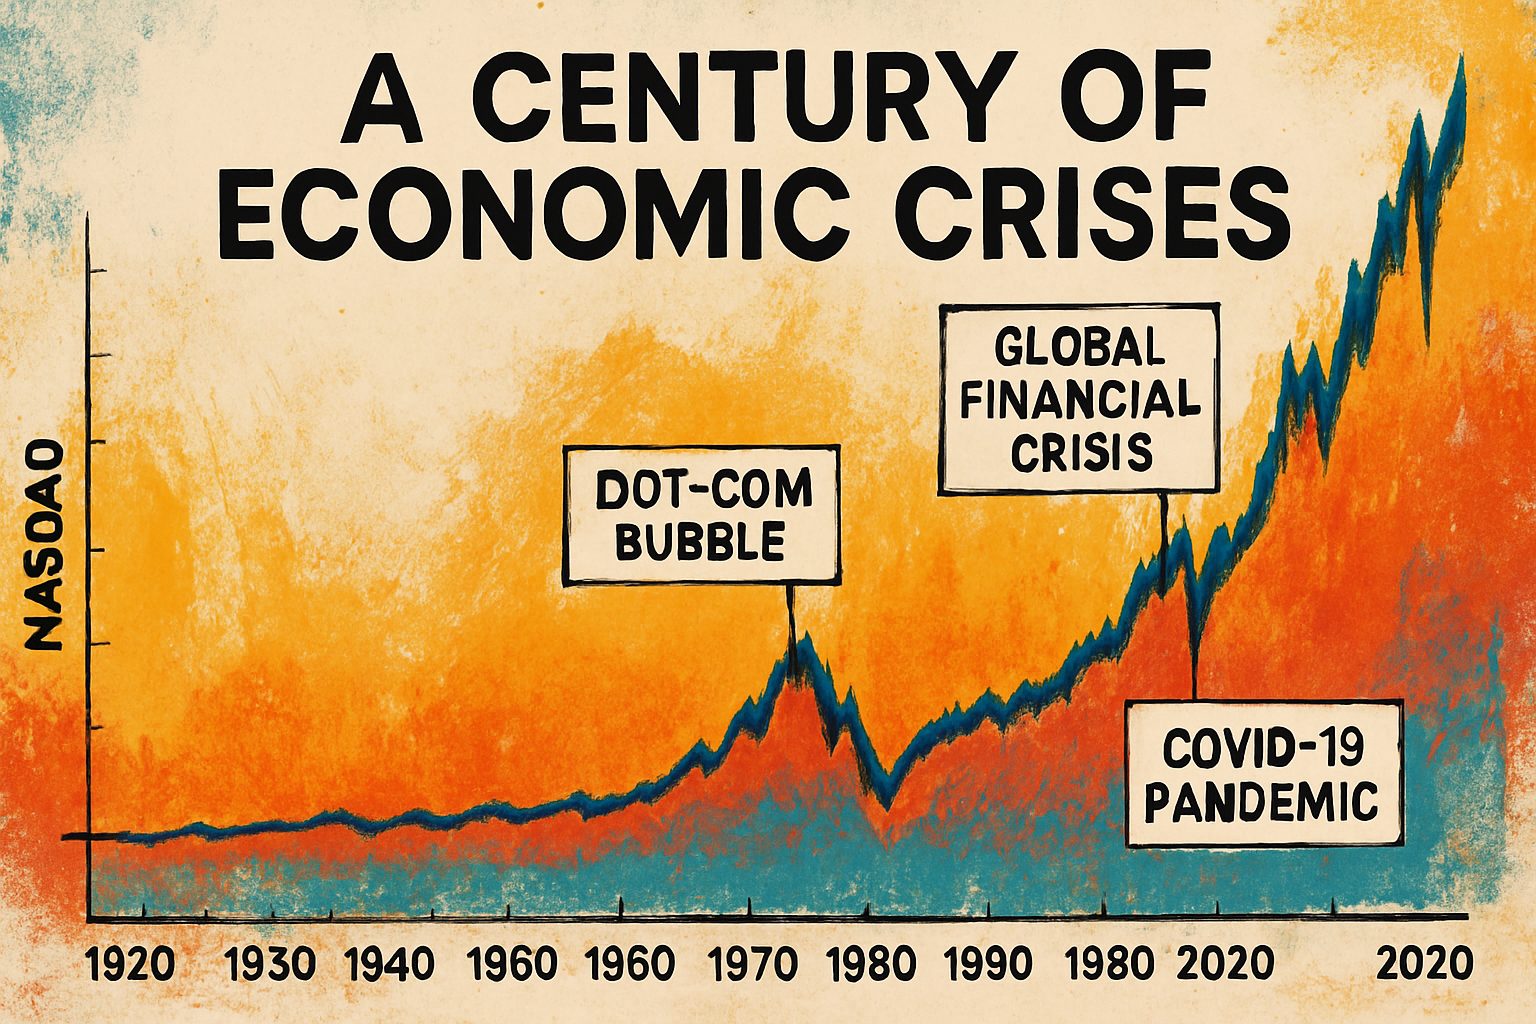
Navigating Economic Turbulence: A Century of NASDAQ’s Resilience and Crises
Dive into a century-long journey of the NASDAQ index as we explore the significant economic crises that have shaped its trajectory. From the Dot-Com Bubble to the COVID-19 pandemic

Revolutionizing Trading: The Power of AI in Brute-Force Parameter Optimization
Discover how artificial intelligence is transforming the brute-force optimization of trading strategy parameters in professional trading. This article dives into innovative techniq
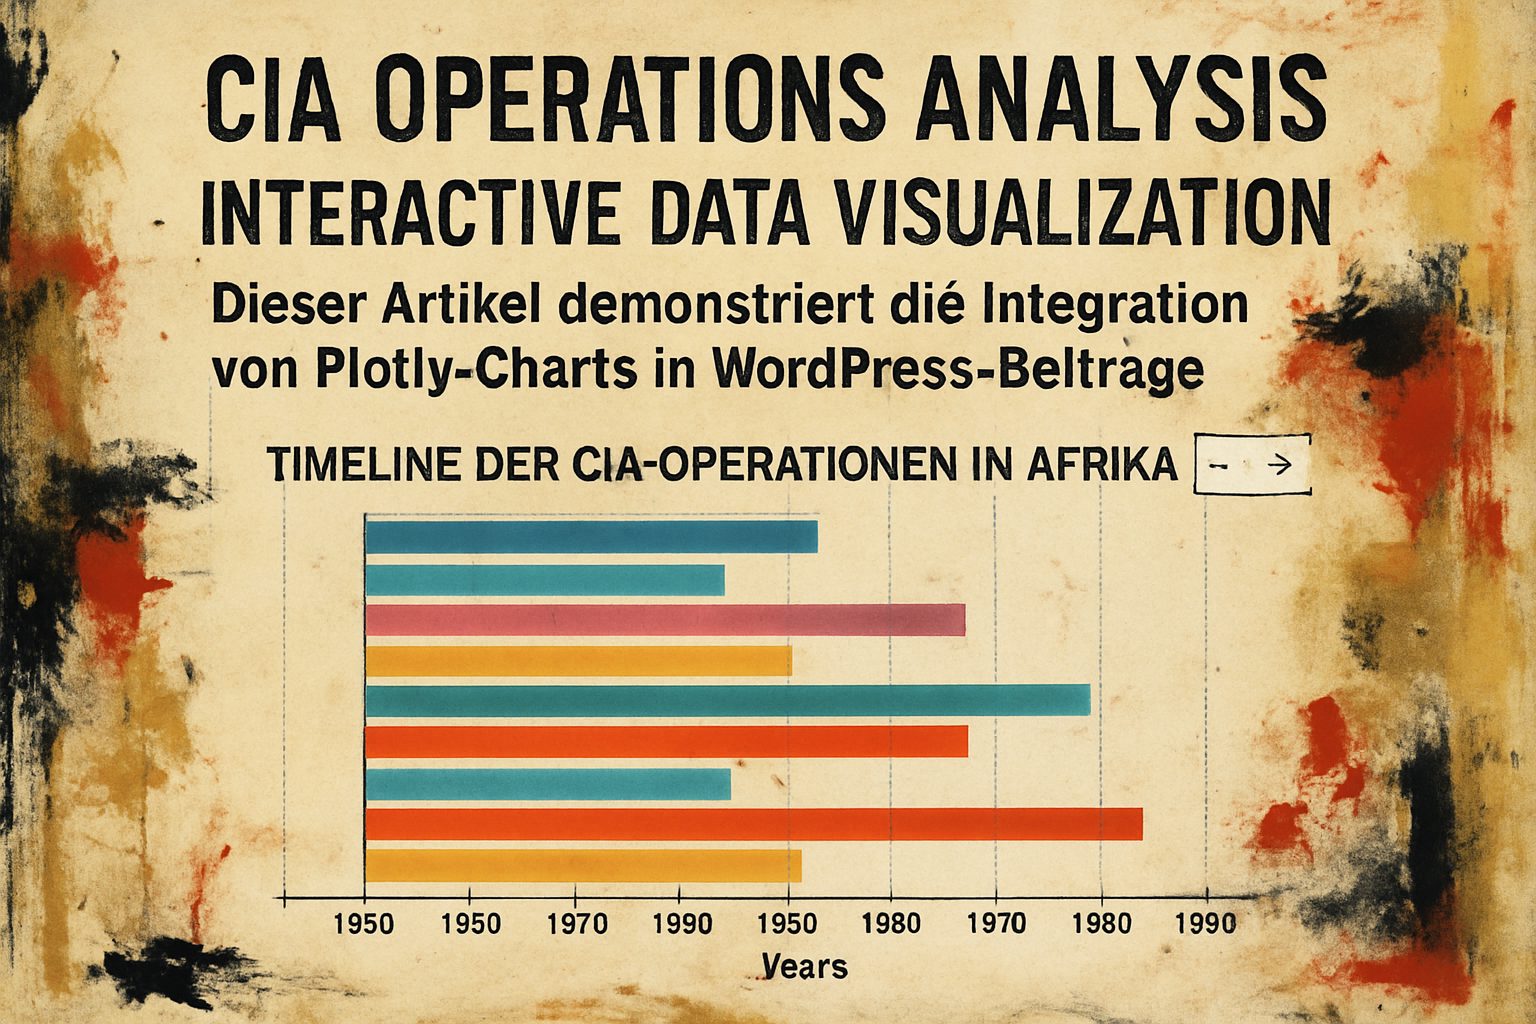
🔍 CIA Operations Analysis: Data Visualization Test – FIXED
Dieser Artikel demonstriert die Integration von Plotly-Charts in WordPress-Beiträge. Timeline der CIA-Operationen in Afrika (1960-1980) Operative Kategorien Verteilung Budget-Entw
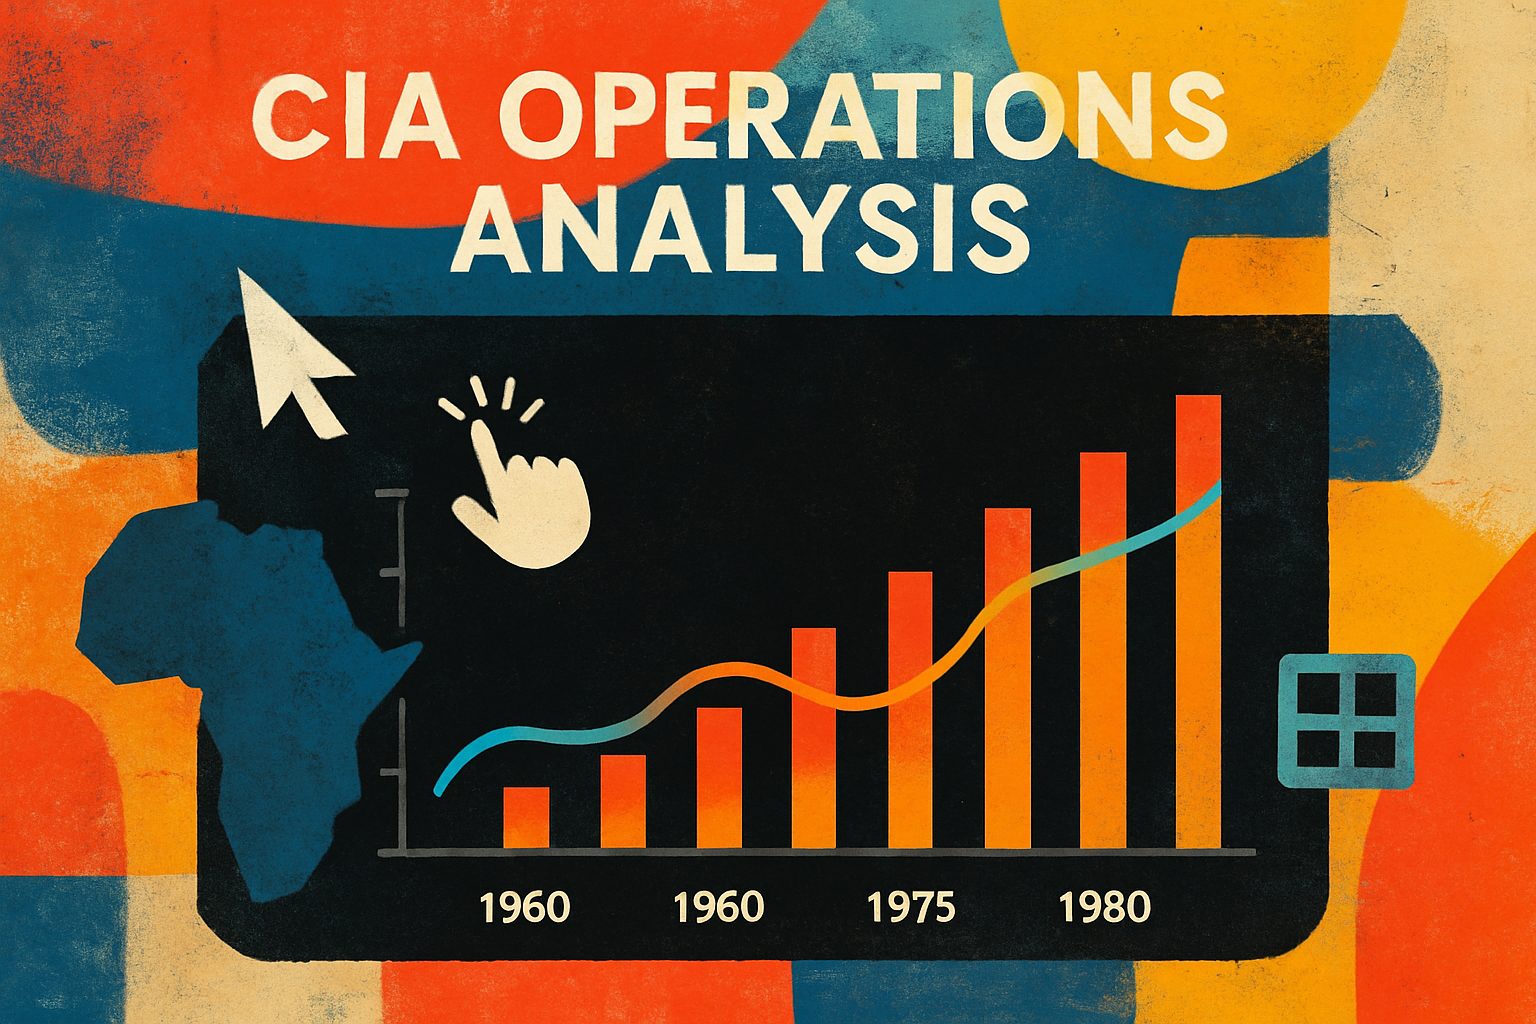
🔍 CIA Operations Analysis: Data Visualization Test
Dieser Artikel demonstriert die Integration von Plotly-Charts in WordPress-Beiträge. Timeline der CIA-Operationen in Afrika (1960-1980) Operative Kategorien Verteilung Budget-Entw